

Who AirDNA is for
AirDNA reads the public Airbnb, Vrbo and Booking.com listing pages every day, separates the nights guests booked from the nights hosts blocked, and turns that into market numbers: how booked a market is, what its listings charge a night, what they earn in a year. Its Rentalizer does the same for a single address, from the listings most like it.
Every week, I send a list to my cold callers with three markets to focus on. Picking those three is what market data is for: which cities still book well, which neighborhoods inside them, and what a two-bedroom there earns before anyone calls a landlord.
Buy it if
- You run rental arbitrage or buy units, and pick new markets every month.
- You size up one unit at a time before you sign a lease, and want to see the listings behind the estimate.
- You want the numbers in a spreadsheet: on a paid plan every chart exports to CSV.
Skip it if
- You only need to price the listings you already run. A pricing tool does that for less.
- Your whole team needs a login. No plan lists team seats, and AirDNA's terms prohibit sharing a password.
- You'd act on one estimate without looking at the listings it came from.
AirDNA pricing: $299 a year for the data, $20 a listing to price
One Market Research subscription covers every market AirDNA tracks, so its price doesn't change with how many listings you run: $299 a year, which the pricing page shows as $25 a month, or $99 month to month. Adapt, AirDNA's pricing tool, is the part that grows with you, at $20 a listing a month, charged only for the listings you switch on to sync.
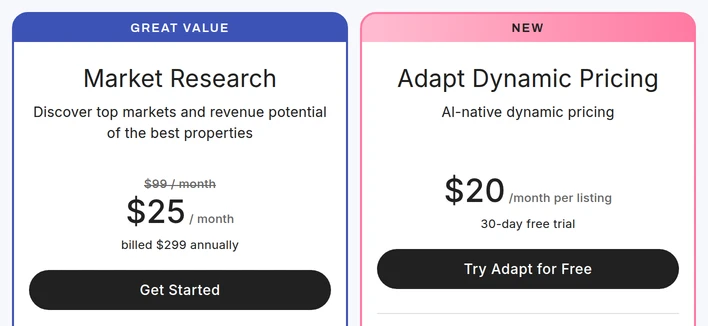
| Plan | Price | What you get |
|---|---|---|
| Free | $0 | Each market's score, revenue, occupancy and daily rate over 12 months in the market list; one sample market in full; Rentalizer estimates with nine of their comps; no charts, submarket detail or exports |
| Market Research | $299 a year ($25 a month), or $99 month to month | 36 months of data, your own comp sets, CSV exports and unlimited Rentalizer PDFs, for every market |
| Adapt pricing | $20 a listing: $200 at 10 listings, $500 at 25, $1,000 at 50 | Charged only for listings with Price Sync on; 30-day free trial |
| Property Manager | Quote, billed yearly | For 6 or more properties: owner contact details and occupancy forecasts |
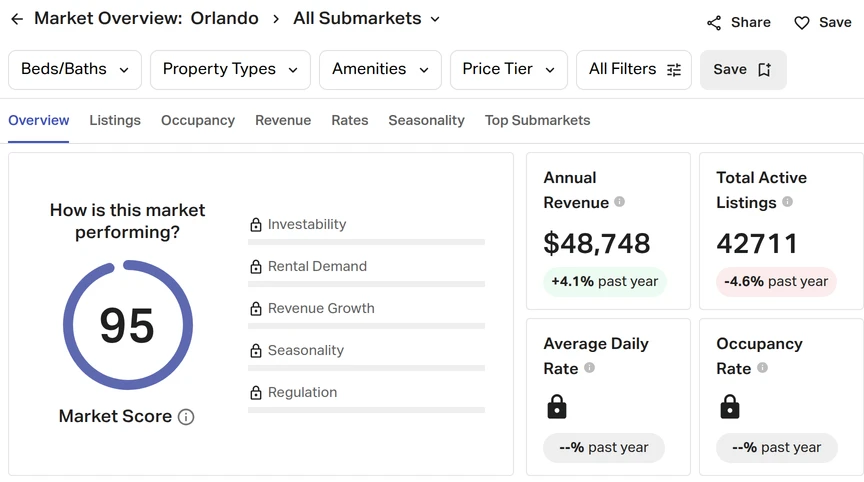
Free is a first look. The market list shows each market's score, revenue, occupancy and daily rate over the last 12 months, but a market's own page stops there: for Orlando, the market our test home is in, it showed the score, the average revenue of $48,748 a year and the 42,711 listings, and locked the occupancy and nightly rate cards, the submarkets' revenue and occupancy, and every chart.
Prices in US dollars, before tax. Paid plans renew on their own. Cancel at least two business days before the renewal date, because AirDNA doesn't refund the unused part of a term.
What you'll look at in Market Research
An estimate for one address
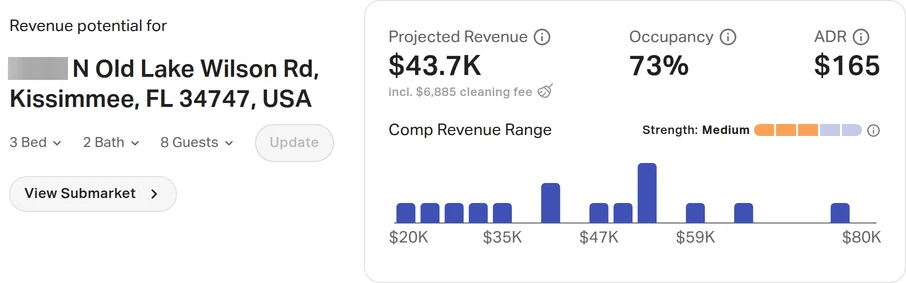
Pick an address and Rentalizer runs at once on its own guess of the unit, so set the bedrooms, bathrooms and guests and press Update: it guessed 2 bedrooms for our 3-bedroom. It projects the year's revenue, cleaning fees included, the occupancy and the average nightly rate, with a strength score for how consistent the comparable listings are. The free plan lists nine of the comps with their nightly rates; their revenue, the rest of the set and Edit Comps need a paid plan.
A market, month by month
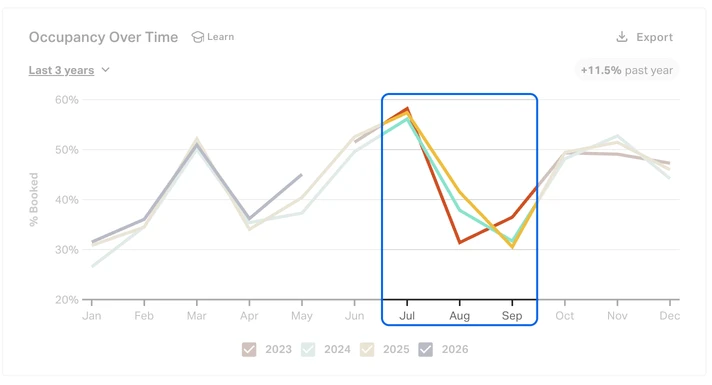
Market pages chart occupancy, rates and revenue by month, 36 months back on Market Research, and each chart downloads as a CSV you can open in Excel or Google Sheets. The free plan doesn't chart them: for our test home's market every one of these charts was locked, so a slow season against a bad year is a paid question.
Adapt, AirDNA's pricing tool
Adapt prices each night from the same data and shows its working. Open a night and you see the base rate and every adjustment for season, demand, lead time and your own rules.
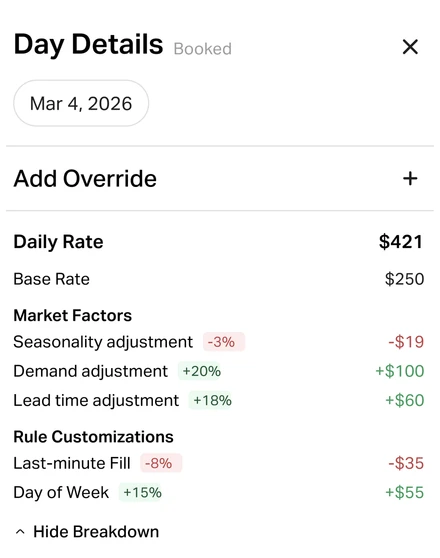
It connects straight to Airbnb, or through Hostaway, Guesty, Uplisting or Hospitable, and publishes rates and minimum stays once a day for each listing you turn on. You can connect for free and see its rates next to yours before anything publishes.
The catch is the price. At $20 a listing, Adapt costs $200 a month at 10 listings against $144.90 for PriceLabs, and $1,000 at 50 against $474.50. If pricing is the job, start with the best Airbnb pricing tool comparison.
Weakest at: the estimate is only as good as its comps
AirDNA says its revenue estimates have matched Airbnb's actual figures with 95% to 99% accuracy, and it checks its model against reservation data that hosts and managers of more than 100,000 properties share with it. That's a claim about markets. An estimate for one address is built from the listings AirDNA picked as comparable, so a unit unlike them still gets their number: a better finish, more reviews, a host who prices well.
Our test shows it. Our pool home is a 3-bedroom house with its own pool. The nine comps the free plan showed were 3-bedroom units in the resort beside the address, four of them titled as condos and one as an apartment. They charge $172 to $234 a night, and the estimate came out at $165 and 73% booked. Wheelhouse's free market report puts every 3-bedroom house in the same area at 41% booked.
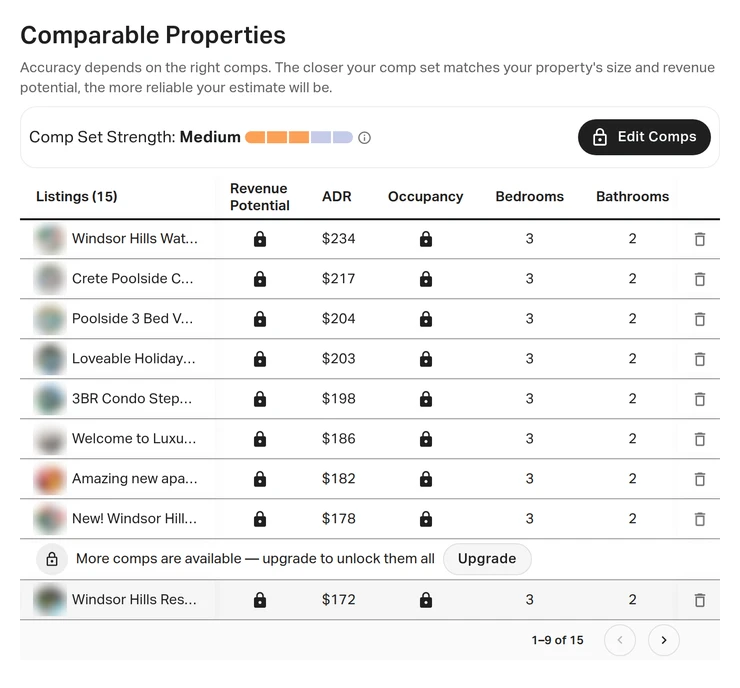
That's why the strength score and the comp set deserve more of your attention than the headline revenue, and why the test below comes before a year's subscription.
Check AirDNA on a unit you already run
Do it on the free plan before you pay for anything. You know the right answer for your own listing, so you'll see how far off the estimate is.
Your numbers: take a listing you've run for a year and pull its revenue, occupancy and average nightly rate for the last 12 months from Airbnb or your PMS.
AirDNA's numbers: put the same address into Rentalizer, change its guess to your bedrooms, bathrooms and guests, and press Update. At two bedrooms, changing the bathrooms and guests didn't move our estimate at all, so the bedroom count is the input that matters.
The comps: if the two are far apart, look at the listings it compared yours with. The free plan shows nine, with their nightly rates; on a paid month you can see them all, swap them and run it again.
A second market: repeat it with a unit somewhere else before you pay for a year.
If it's close on the units you know, take the yearly plan: $299 costs about what three months at $99 do.
Weighing STR Insights too? STR Insights vs AirDNA runs the same inputs through both. Pricing the listings you already run? AirDNA vs PriceLabs puts Adapt against PriceLabs at 10, 25 and 50 listings.
Once the markets are picked, someone has to call
Market data tells you where to look. The leases come from calls: landlords and property managers in those markets who'll agree to a sublet. Our cold calling virtual assistants train on the arbitrage pitch and the common landlord objections before the first dial, then work your list and book the conversations worth your time.
If an assistant will run the research too, give them an AirDNA login of their own; the terms don't allow a shared password. Most placements take 3 to 4 days from the first call. Book a free consultation and we'll scope the role around your markets.